
Vendor Scorecard Guide: Metrics, Templates & Retailer Examples
Last Updated: Mar 20, 2026
Everything you need to know about vendor scorecards—from choosing the right metrics and building weighted scoring templates to understanding the exact scorecards used by Walmart, Amazon, Target, Home Depot, and Kroger. Learn how to measure, improve, and protect your supplier performance ratings.
This guide contains AI-generated content based on publicly available information and general industry knowledge. Always verify requirements directly with your retail trading partners.
In This Guide
What is a Vendor Scorecard?
A vendor scorecard is a structured evaluation tool that organizations use to measure, track, and compare the performance of their suppliers against defined criteria. It translates qualitative judgments—“this supplier is reliable”—into quantitative scores that can be compared over time and across vendors.
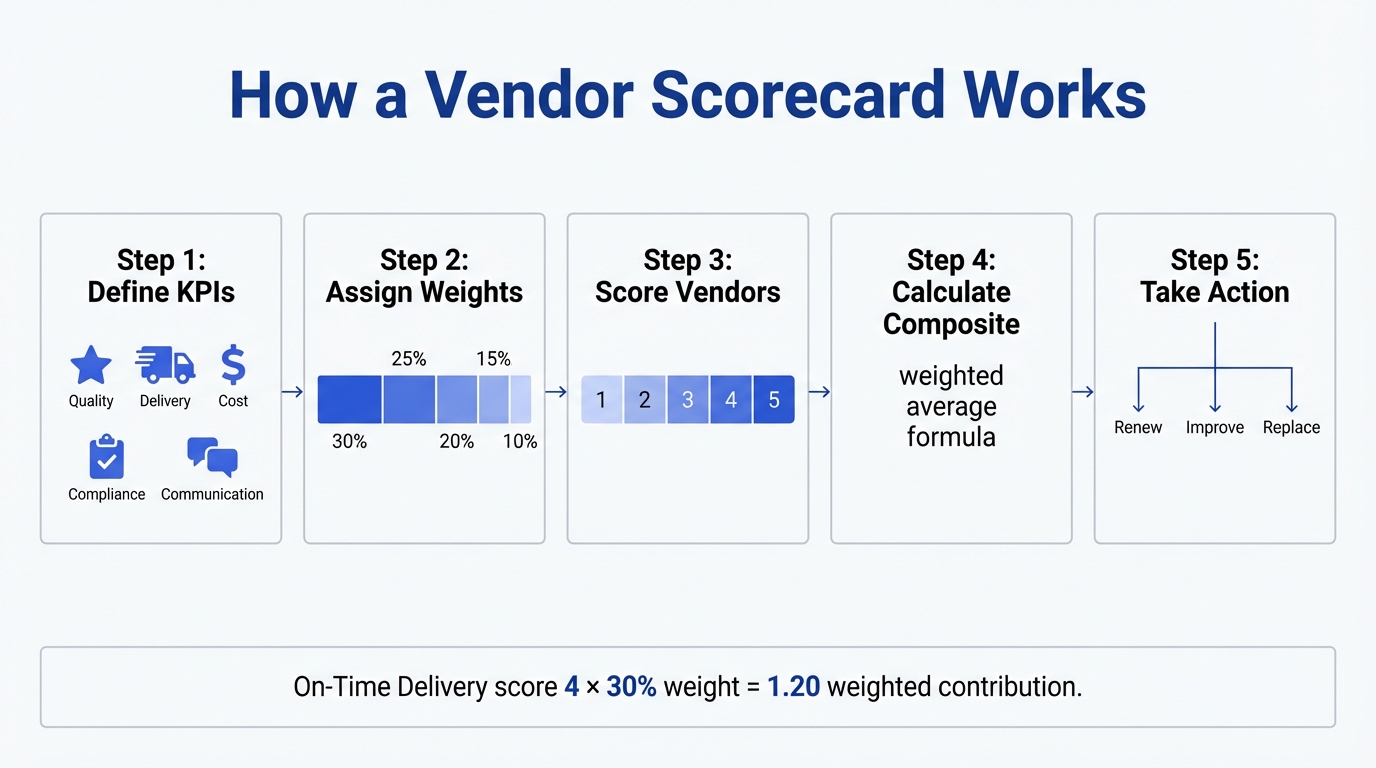
Also referred to as a supplier scorecard, vendor performance scorecard, or vendor evaluation matrix, the concept is the same: you define the key performance indicators (KPIs) that matter to your business, assign weights to reflect their relative importance, collect data on each vendor’s performance, and compute a composite score. The result is an objective, repeatable framework for vendor management decisions—from contract renewals and volume allocation to corrective action plans and supplier termination.
Vendor scorecards are used across virtually every industry. In manufacturing, procurement teams score raw material suppliers on quality yields and lead time consistency. In healthcare, hospital systems evaluate medical device vendors on regulatory compliance and service responsiveness. In technology, IT departments rate SaaS providers on uptime, support resolution time, and security posture.
But vendor scorecards take on a uniquely high-stakes role in retail supply chains. Major retailers like Walmart, Amazon, Target, Home Depot, and Kroger operate vendor scorecards that directly determine whether suppliers keep their shelf space, receive favorable terms, or face financial penalties. Later in this guide, we break down the actual vendor scorecards used by Walmart, Amazon, Target, Home Depot, and Kroger—including their exact metrics, thresholds, and chargeback penalties.
Key Facts
- ●Also known as: Supplier scorecard, vendor performance scorecard, supplier evaluation matrix, vendor rating card
- ●Used by: Procurement, supply chain, category management, and vendor compliance teams
- ●Common metrics: Quality, on-time delivery, fill rate, cost competitiveness, compliance, communication
- ●Review frequency: Monthly, quarterly, or annually depending on the organization
- ●Retail context: Major retailers operate automated scorecards with real financial consequences (chargebacks, holds, deauthorization)
Why Vendor Scorecards Matter
Without a formal scorecard, vendor management devolves into gut feel and recency bias. The supplier who caused a crisis last month gets scrutinized; the one who has been quietly underperforming for two years flies under the radar. A vendor scorecard replaces anecdote with evidence and makes performance conversations objective rather than adversarial.
Here are the core benefits that make vendor scorecards indispensable for any organization that relies on external suppliers:
Data-Driven Decisions
Scorecards turn subjective opinions into measurable data points. When it’s time to renew a contract, allocate volume, or select a new supplier, the scorecard provides an auditable basis for the decision—not politics or personal relationships.
Vendor Risk Reduction
Tracking vendor risk through KPI trends surfaces problems before they become emergencies. A gradual decline in on-time delivery or a spike in defect rates shows up in the scorecard long before it causes a stockout or recall. Early warning means early intervention.
Cost Savings
Poor vendor performance is expensive: expedited shipping to cover late deliveries, rework on defective goods, chargebacks from retailers for non-compliance. Scorecards quantify these costs and create accountability. Organizations that implement vendor scorecards consistently report meaningful reductions in total cost of poor quality as underperforming suppliers are identified and held accountable.
Stronger Supplier Relationships
Counterintuitively, scorecards improve vendor relationships rather than damage them. When expectations are clearly defined and performance is transparently measured, suppliers know exactly where they stand. The best suppliers welcome scorecards because they differentiate themselves from weaker competitors.
Continuous Improvement
Scorecards create a feedback loop. Each review cycle identifies gaps, triggers corrective actions, and sets targets for the next period. Over time, this ratchet effect raises the overall performance of your entire supply base—not just individual vendors.
Compliance & Chargeback Prevention
In retail, vendor scorecards are directly tied to chargebacks and financial penalties. Walmart’s OTIF fines, Amazon’s operational holds, and Target’s automated deductions all flow from scorecard metrics. Monitoring your scorecard proactively is the single most effective way to prevent chargebacks.
The stakes in retail: Unlike internal procurement scorecards where a low score might delay a contract renewal, a poor vendor scorecard at Walmart or Amazon can trigger immediate financial penalties—chargebacks of $5+ per PO line, operational holds on your entire account, or merch returns at your expense. In retail, the vendor scorecard is not a performance review—it’s a financial instrument.
Key Vendor Scorecard Metrics
The metrics you choose define the behavior you incentivize. A scorecard that only measures cost will produce vendors who cut corners on quality. One that only measures delivery speed will produce vendors who ship incomplete orders just to hit the date. The best vendor scorecards balance multiple dimensions to create a holistic view of vendor performance.
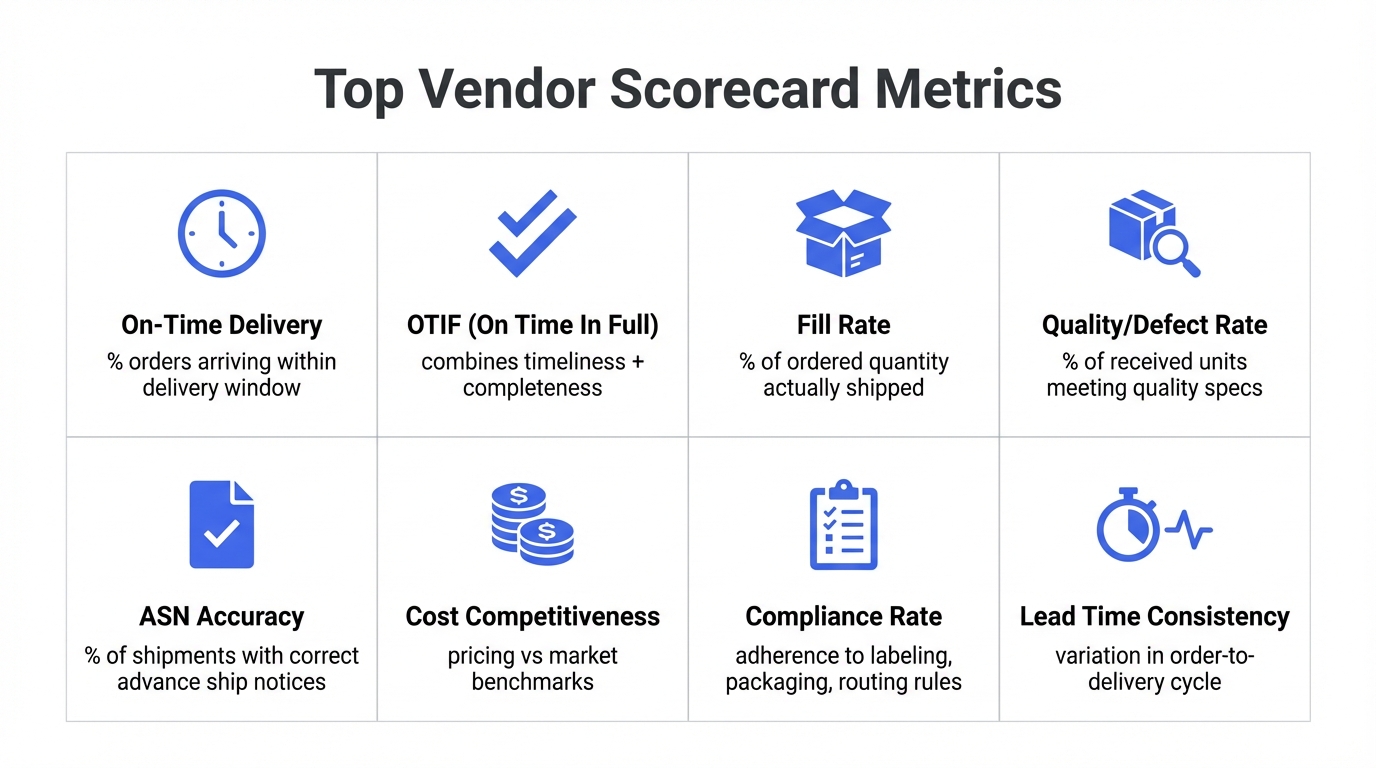
Below are the most common vendor scorecard KPIs used across industries, along with practical guidance on how to measure each one. These KPIs form the foundation of any effective vendor evaluation program:
| Metric | Description | How to Measure |
|---|---|---|
| On-Time Delivery | Percentage of orders delivered within the agreed delivery window. In retail, this is often measured as OTIF (On Time, In Full). | (Orders delivered on time / Total orders) x 100. Track against the PO-level delivery date, not the ship date. |
| Fill Rate | Percentage of ordered units actually shipped. Measures the vendor’s ability to fulfill the complete order without short-shipping. | (Units shipped / Units ordered) x 100. Measure at PO-line level for granularity. Distinguish between original and revised fill rate. |
| Quality / Defect Rate | Percentage of received units that fail quality inspection, are defective, or require rework. Includes cosmetic defects, functional failures, and spec deviations. | (Defective units / Total units received) x 100. Track by defect category (cosmetic, functional, safety) for root cause analysis. |
| Cost Competitiveness | How the vendor’s pricing compares to market benchmarks, historical pricing, and competitive quotes for equivalent products or services. | Compare unit cost against market index, previous period pricing, and alternative supplier quotes. Include total landed cost (freight, duties, handling). |
| Compliance | Adherence to packaging, labeling, routing, EDI, and documentation requirements. In retail, this covers ASN accuracy, GS1-128 labels, carton markings, and routing guide compliance. | Track compliance violations per shipment. Common categories: labeling errors, ASN inaccuracies, routing violations, packaging non-conformance. |
| Communication & Responsiveness | How quickly and effectively the vendor responds to inquiries, issue escalations, PO acknowledgments, and change requests. | Measure average response time to PO acknowledgments, inquiry responses, and escalation resolution. Track PO confirmation rate and timeliness. |
| Lead Time Consistency | Variance between quoted lead time and actual lead time across orders. Consistent lead times enable better demand planning and inventory management. | Calculate standard deviation of actual lead times vs. quoted lead time over a rolling period. Flag orders where actual lead time exceeds quoted by more than 10%. |
| Invoice Accuracy | Percentage of invoices that match the PO and receiving records on the first submission, without requiring corrections or disputes. | (Invoices matched on first pass / Total invoices) x 100. Track common error types: wrong price, wrong quantity, missing PO reference, duplicate invoices. |
| Innovation & Improvement | Vendor’s contribution to product innovation, process improvement suggestions, cost reduction ideas, and willingness to invest in the partnership. | Qualitative assessment scored during business reviews. Track number of improvement suggestions, cost savings delivered, and new product development contributions. |
| Sustainability & Social Responsibility | Compliance with environmental standards, ethical sourcing requirements, labor practices, and sustainability targets set by the buying organization. | Track certifications (ISO 14001, SA8000, B Corp), audit results, carbon footprint data, and compliance with restricted substance lists. |
Pro tip: Start with 5–7 metrics maximum. Every additional metric dilutes focus and increases the data collection burden. You can always add more metrics later as your scorecard program matures. The most critical metrics for most organizations are on-time delivery, quality/defect rate, and fill rate—these three alone cover the majority of vendor performance issues.
How to Create a Vendor Scorecard
Building an effective vendor scorecard is a structured process. Follow these steps to create a scorecard that drives real performance improvement rather than collecting dust in a shared drive:
Define Your Goals
Start by asking: what business outcomes do we want the scorecard to drive? Common goals include reducing defect rates, improving on-time delivery, lowering total cost of ownership, ensuring regulatory compliance, or reducing chargeback exposure from retail customers. Your goals determine which metrics matter and how they should be weighted.
Choose Your KPIs
Select 5–7 KPIs that align with your goals. Each KPI must be measurable with data you can actually collect. If you can’t reliably measure it, don’t include it—a KPI with bad data is worse than none at all. Refer to the metrics table above for vendor evaluation criteria. Ensure you cover at least quality, delivery, and cost dimensions.
Assign Weights
Not all metrics are equally important. Assign a percentage weight to each metric so that the weights sum to 100%. For example, if on-time delivery is your biggest pain point, weight it at 30%. If quality is table stakes, weight it at 25%. Cost might be 20%, compliance 15%, and communication 10%. The weights encode your priorities into the scorecard math.
Establish a Rating Scale
Define how each metric will be scored. The most common approach is a 1–5 scale: 1 = Unacceptable, 2 = Needs Improvement, 3 = Meets Expectations, 4 = Exceeds Expectations, 5 = Exceptional. For each metric, document specific thresholds that correspond to each score level. For example: On-time delivery ≥98% = 5, 95–97% = 4, 90–94% = 3, 80–89% = 2, <80% = 1.
Collect Data and Score
For each vendor, collect the raw data for every metric, convert it to a score using your rating scale, multiply each score by its weight, and sum the weighted scores to produce a composite score. Automate this as much as possible—pull data from your ERP, WMS, or quality management system rather than relying on manual data entry.
Set Review Frequency
Decide how often you will review and share scorecard results. Monthly reviews work best for high-volume, operationally critical suppliers. Quarterly reviews suit most strategic suppliers. Annual reviews are only appropriate for low-risk, commodity suppliers. Whatever frequency you choose, stick to it—inconsistent reviews undermine the entire program.
Share Results and Act
A scorecard locked in an internal spreadsheet has zero impact. Share results with each vendor in a formal review meeting. Celebrate high scores, discuss areas for improvement, and collaboratively develop corrective action plans for low-scoring areas. Set specific, time-bound targets for the next review cycle. The scorecard is only as valuable as the conversations it enables.
Vendor Scorecard Template
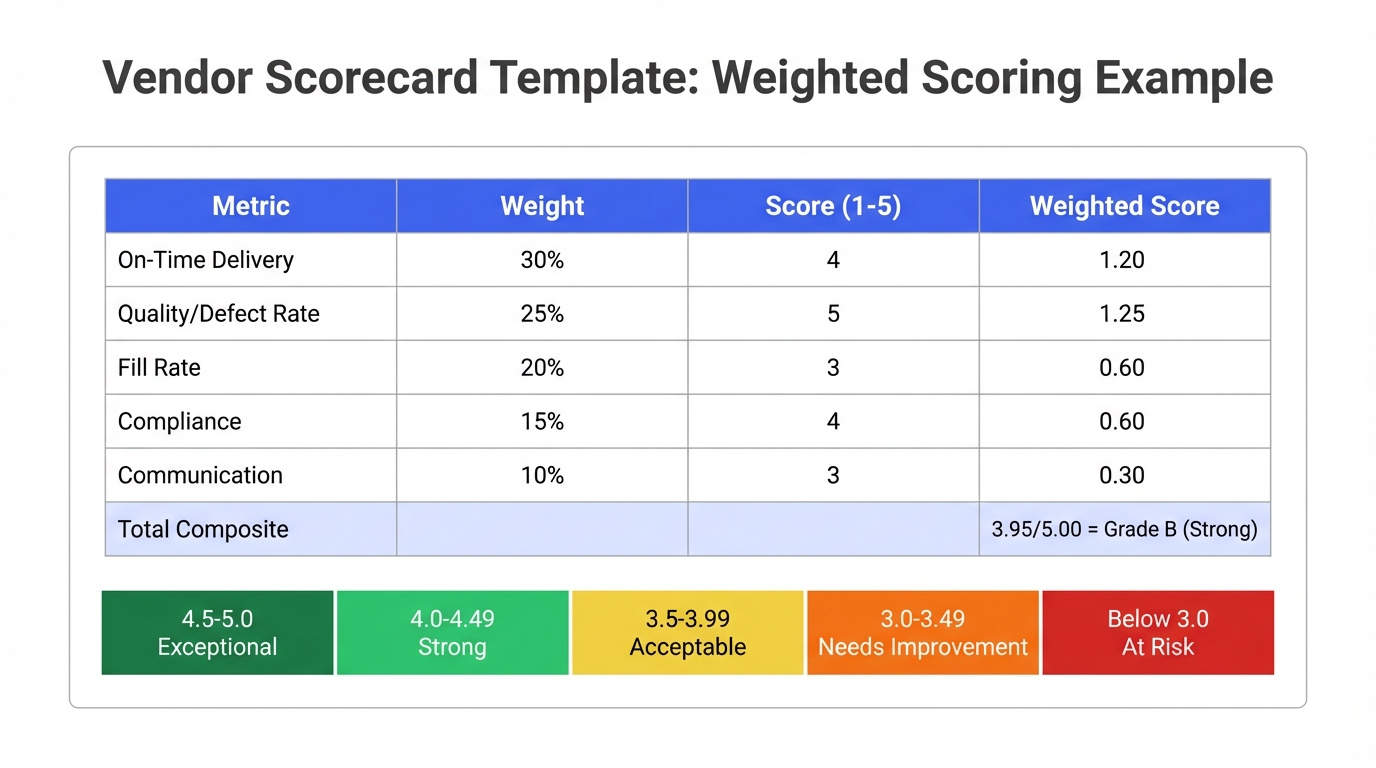
Below is a practical vendor scorecard template with sample data showing how weighted scoring works in practice. This example evaluates a hypothetical supplier using six metrics on a 1–5 scale with percentage weights:
| Metric | Weight | Raw Data | Score (1–5) | Weighted Score |
|---|---|---|---|---|
| On-Time Delivery | 30% | 96.2% | 4 | 1.20 |
| Quality / Defect Rate | 25% | 0.3% defect rate | 5 | 1.25 |
| Fill Rate | 20% | 91.5% | 3 | 0.60 |
| Cost Competitiveness | 10% | 3% above market avg | 3 | 0.30 |
| Compliance | 10% | 2 labeling violations | 2 | 0.20 |
| Communication | 5% | Avg 4hr response time | 4 | 0.20 |
| Composite Score | 100% | 3.75 / 5.00 | ||
Score Interpretation Guide
Exceptional
4.50–5.00
Preferred supplier; expand relationship
Strong
3.75–4.49
Reliable; address minor gaps
Acceptable
3.00–3.74
Meets baseline; improvement needed
At Risk
2.00–2.99
Corrective action plan required
Unacceptable
1.00–1.99
Replace or terminate supplier
In the example above, the supplier scores a 3.75 out of 5.00—solidly in the “Strong” range. However, the scorecard immediately reveals two areas requiring attention: the fill rate of 91.5% (below the typical 95% target for retail) and two compliance violations in labeling. Without a scorecard, these issues might go unnoticed while the supplier coasts on its excellent quality numbers.
Customize for your business: The weights and rating thresholds in this template are starting points. Adjust them based on your industry, supplier type, and strategic priorities. A food manufacturer might weight quality at 40% and delivery at 25%, while an electronics distributor might weight delivery at 35% and cost at 20%. The right weights are the ones that reflect your actual priorities.
Retailer Vendor Scorecards: How Major Retailers Grade Suppliers
While the generic vendor scorecard framework above works well for internal procurement, the reality for consumer goods suppliers is that your most important scorecards are the ones your retail customers maintain on you. These are not spreadsheets you control—they are automated dashboards built into retailer portals that track your performance on every purchase order, shipment, and ASN in real time.
Falling below threshold on any of these metrics triggers chargebacks, compliance letters, and in severe cases, operational holds or deauthorization. Understanding what each retailer measures and how they penalize non-compliance is essential for any supplier selling into major retail.
The retailer-specific scorecard details below are sourced from our analysis of publicly available retailer compliance information, including requirements published by Walmart, Amazon, Target, Home Depot, and Kroger. This content is for general educational purposes—always verify current requirements directly with your retail trading partners.
Walmart
Retail Link / Supplier One — Supplier Performance Scorecard
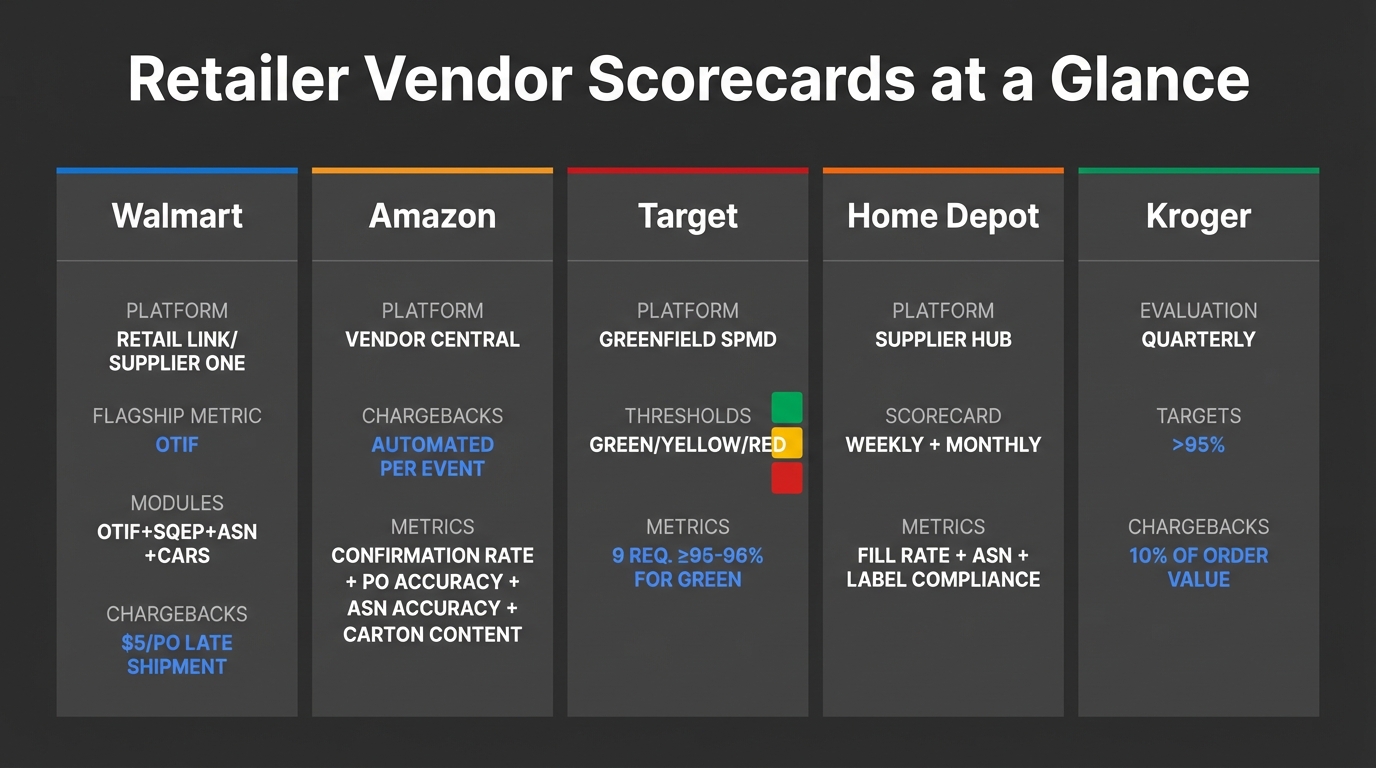
Walmart’s Supplier Performance Scorecard is accessible through Retail Link and the newer Supplier One portal. The scorecard is organized into five core modules: OTIF, SQEP, ASN Accuracy, FMP, and CARS. OTIF (On Time, In Full) is the flagship metric and has become the defining compliance standard in retail supply chains. Walmart publishes detailed scorecards that break performance down to the PO and item level.
Key Metrics
Chargebacks & Penalties
Source: Walmart Supply Chain Standards (rev. 04/2023); Supplier Performance Scorecard via Retail Link / Supplier One
Amazon
Vendor Central — Operational Performance Dashboard
Amazon evaluates vendor performance through the Operational Performance Dashboard in Vendor Central. Unlike traditional scorecards with periodic reviews, Amazon’s system is fully automated—chargebacks are generated per non-compliance event in real time. The dashboard tracks five core operational metrics, and repeated failures trigger escalating consequences from chargebacks to merch returns and operational holds.
Key Metrics
Chargebacks & Penalties
Source: Amazon Vendor Central Operational Performance documentation; North American Vendor Shipment Preparation Manual
Target
Greenfield — Supplier Performance Management Dashboard (SPMD)
Target evaluates suppliers through the Supplier Performance Management Dashboard (SPMD) in its Greenfield portal. The SPMD uses a Green/Yellow/Red threshold system across nine key metrics, making it immediately clear where a supplier stands. Target’s scorecard is notable for its granularity—metrics are tracked at the PO-location level, and automated chargebacks are generated for each individual non-compliant event.
Key Metrics
Chargebacks & Penalties
Source: Target Supplier Performance Management Dashboard (SPMD) documentation; Target Greenfield portal guidelines
Home Depot
Supplier Hub — Supplier Scorecard (Weekly + Monthly)
Home Depot publishes vendor scorecards through its Supplier Hub portal on both a weekly and monthly cadence. The scorecard focuses on three primary areas: Fill Rate and On-Time performance, ASN Compliance, and Label Compliance. Home Depot’s scorecard is tightly integrated with its receiving operations—label and ASN compliance directly affect how efficiently shipments can be processed at the RDC (Rapid Deployment Center).
Key Metrics
Chargebacks & Penalties
Source: Home Depot Supplier Hub documentation; RDC Supplier Requirements Guide (rev. 04/2022); Barcode Specifications (rev. 04/2017)
Kroger
Kroger Vendor Portal — Quarterly Supplier Evaluation
Kroger evaluates suppliers on a quarterly basis across four primary operational metrics: Fulfillment Rate, Cancel Rate, On-Time Shipment, and Return Rate. Kroger’s chargeback structure is notably aggressive—penalties are calculated as a percentage of order value for operational failures and flat fees for packaging and routing violations. The quarterly cadence means that a bad quarter can result in significant cumulative chargebacks.
Key Metrics
Chargebacks & Penalties
Source: Kroger vendor compliance documentation; Kroger Standard Vendor Agreement chargeback schedule
Last verified: March 2026 · Based on publicly available retailer compliance information
Note: Retailer scorecard metrics and thresholds change frequently. Always confirm current requirements directly with each retailer’s vendor compliance team or through their supplier portal. Browse retailer-specific compliance requirements →
Know where you stand
Not sure what metrics your retailer tracks?
RetailerHub’s Compliance IQ lets you ask any scorecard question—“What OTIF threshold does Walmart use?” or “How does Target calculate fill rate?”—and get instant, accurate answers.
How to Improve Your Vendor Scorecard
If your vendor scorecard is underperforming—whether it’s an internal procurement scorecard or a retailer’s supplier performance dashboard—the path to improvement follows the same principles. You need to identify the specific metrics dragging down your composite score, understand the root causes, and implement targeted fixes.
Here are the highest-impact actions you can take to improve your vendor scorecard KPIs and reduce vendor risk, especially in a retail supply chain context:
1. Fix ASN Accuracy First
The Advance Shipment Notification (ASN) is the single data element that touches the most scorecard metrics: on-time accuracy, confirmation rate, carton content accuracy, and receiving compliance. An inaccurate ASN cascades into multiple scorecard failures. Ensure every ASN is transmitted within the retailer’s required window, contains accurate SSCC and item data, and matches the physical shipment exactly.
2. Ship On Time, Every Time
On-time delivery (or OTIF—On Time, In Full) is the single most heavily weighted metric on most retail scorecards. Build buffer time into your production schedule. Ship 1–2 days early when possible (within the retailer’s delivery window). Invest in real-time shipment tracking so you can intervene when a shipment is at risk of being late rather than discovering it after the fact.
3. Get Your Labels Right
Labeling compliance is one of the easiest scorecard metrics to fix and one of the most costly to ignore. Ensure your GS1-128 shipping labels are correctly formatted, placed in the right location, and scannable at Grade B or higher. Invest in a barcode verifier—not just a scanner—to catch quality issues before shipment.
4. Improve Fill Rates with Demand Planning
Low fill rates (shipping less than ordered) are typically caused by inventory shortages, production delays, or poor demand forecasting. Invest in demand planning tools, maintain safety stock for high-velocity SKUs, and communicate proactively with buyers when you anticipate shortages. A revised PO with the buyer’s approval is always better than a short shipment that triggers a chargeback.
5. Monitor Your Scorecard Proactively
Don’t wait for a quarterly business review to discover your scorecard is in the red. Log into your retailer’s supplier portal weekly—Walmart’s Retail Link, Amazon’s Vendor Central, Target’s Greenfield, Home Depot’s Supplier Hub, Kroger’s partner portal—and review your metrics. Set up alerts for chargebacks and deductions so you can dispute them within the retailer’s window.
6. Communicate Proactively with Buyers
When problems arise—and they will—communicate immediately. Retailers penalize surprises far more harshly than known issues. If a shipment will be late, notify the buyer before the delivery window closes. If you need to short-ship, request a PO revision. Proactive communication doesn’t eliminate penalties, but it protects the relationship and can sometimes result in waived chargebacks.
Turn scorecard metrics into action. RetailerHub’s Instant SOPs generate warehouse-ready procedures for each retailer account, so your team follows the exact processes that drive better scorecard performance. See plans →
Common Vendor Scorecard Mistakes
Whether you are building your own vendor scorecard to evaluate your suppliers, or trying to improve your scores on a retailer’s scorecard, these are the most common mistakes that undermine scorecard programs:
Impact
All metrics are treated as equally important, which distorts the composite score. A vendor with perfect quality but terrible delivery gets the same score as one with perfect delivery but terrible quality—even though delivery might matter far more to your business.
Fix
Assign percentage weights that sum to 100%. Weight each metric according to its actual business impact. Review and adjust weights annually as priorities change.
Impact
Annual or semi-annual reviews allow problems to fester for months before detection. By the time you identify a declining supplier, the damage—stockouts, chargebacks, customer complaints—is already done.
Fix
Score monthly for critical and high-volume suppliers. Score quarterly at minimum for all strategic suppliers. Automate data collection to reduce the administrative burden of frequent reviews.
Impact
Building an internal scorecard while ignoring the scorecards your retail customers maintain on you. Your internal scorecard might show green across the board while Walmart is generating OTIF chargebacks and Target has you in Red status.
Fix
Monitor retailer scorecards at least weekly. Map your internal metrics to each retailer’s specific metrics and thresholds. Make retailer scorecard performance a standing agenda item in your S&OP meetings.
Impact
Measuring performance without acting on it is worse than not measuring at all—it signals that low scores have no consequences. Vendors learn that the scorecard is toothless, and performance stagnates or declines.
Fix
Require a formal corrective action plan (CAP) for any metric that falls below threshold. Include specific actions, owners, deadlines, and follow-up review dates. Escalate if the CAP is not completed or if performance does not improve.
Impact
A scorecard with 15+ metrics overwhelms reviewers, dilutes the weight of each metric, and makes it nearly impossible for vendors to know what to prioritize. Analysis paralysis replaces actionable insight.
Fix
Limit to 5–7 core metrics. If you need more granularity, create a summary scorecard (5–7 metrics) for executive review and a detailed scorecard (10–15 metrics) for operational teams. Most vendor conversations should focus on the summary.
Impact
Manual data entry introduces errors, delays, and inconsistency. Reviewers spend their time gathering data instead of analyzing it. The scorecard becomes a burden rather than a tool, and the program slowly dies.
Fix
Automate data feeds from your ERP, WMS, and quality systems. Use APIs to pull receiving data, chargeback data, and compliance metrics directly into the scorecard. Reserve manual input only for qualitative metrics like innovation and communication.
Impact
A scorecard that lives only inside your organization provides zero feedback to the vendors who need it most. Vendors cannot improve what they don’t know is being measured, and they cannot course-correct on metrics they’ve never seen.
Fix
Share scorecard results in a formal quarterly business review (QBR). Provide the vendor with their scores, trend data, benchmarks vs. peers (anonymized), and specific improvement targets for the next period.
Impact
Accepting every retailer chargeback at face value leaves money on the table. Retailers’ automated chargeback systems generate false positives—incorrect carrier data, receiving errors, system glitches—that are reversible if disputed with proper documentation.
Fix
Implement a chargeback review process. Audit every chargeback within the retailer’s dispute window (typically 30–90 days). Gather proof of delivery, ASN confirmation, and carrier documentation. Industry estimates suggest 15–30% of chargebacks can be successfully disputed.
Frequently Asked Questions
What is a vendor scorecard?
A vendor scorecard is a structured evaluation tool that measures and tracks supplier performance against defined criteria such as quality, delivery, cost, compliance, and communication. It converts subjective assessments into quantitative scores using weighted metrics, enabling data-driven decisions about vendor management, contract renewals, and corrective actions. Also called a supplier scorecard or vendor performance scorecard.
What is the difference between a vendor scorecard and a supplier scorecard?
There is no functional difference—vendor scorecard and supplier scorecard are interchangeable terms for the same tool. "Vendor" is more commonly used in retail and distribution contexts, while "supplier" is more common in manufacturing and procurement. Some organizations use "vendor" for service providers and "supplier" for goods providers, but this distinction is not universal.
What metrics should I include in a vendor scorecard?
The most essential metrics are on-time delivery, quality/defect rate, and fill rate—these three cover the majority of vendor performance issues. Beyond those, consider cost competitiveness, compliance (labeling, packaging, EDI), communication responsiveness, and lead time consistency. Limit your scorecard to 5–7 core metrics to maintain focus. Weight each metric according to its importance to your business.
How often should I review vendor scorecards?
Monthly for high-volume and operationally critical suppliers, quarterly for strategic suppliers, and annually for low-risk commodity suppliers. In retail, retailer-maintained scorecards (Walmart, Amazon, Target, etc.) are updated continuously or monthly, so you should monitor your scores at least weekly to catch issues early and dispute chargebacks within the required window.
What is OTIF and why does it matter for vendor scorecards?
OTIF stands for On Time, In Full. It measures the percentage of orders that are both delivered within the agreed time window AND contain the complete ordered quantity. OTIF is the single most important metric on retail vendor scorecards—Walmart popularized it as the gold standard for supply chain performance. A low OTIF score triggers chargebacks and can jeopardize your shelf space and trading partner relationship.
How do retailer vendor scorecards affect my business?
Retailer vendor scorecards directly impact your profitability through chargebacks (financial penalties for non-compliance), your growth through volume allocation decisions, and your business continuity through operational holds or deauthorization in severe cases. Walmart, Amazon, Target, Home Depot, and Kroger all operate automated scorecard systems that generate real-time financial consequences for poor performance.
What is a good vendor scorecard score?
On a 1–5 scale, a composite score of 4.0+ is generally considered strong, 3.5–3.99 is acceptable, and below 3.0 requires corrective action. For retailer-specific scorecards, each retailer defines its own thresholds: Target uses Green (≥96%), Yellow, and Red zones; Walmart measures OTIF against specific percentage targets; Kroger expects >95% fulfillment and on-time rates. Always benchmark against each retailer’s specific thresholds, not a generic scale.
How can I improve my vendor scorecard at Walmart?
Focus on OTIF first—it is Walmart’s flagship metric. Ship within the delivery window (not early, not late), ship the full PO quantity, transmit accurate ASNs via EDI before shipment arrives, acknowledge POs promptly, and submit inventory feeds on time. Monitor your scorecard weekly through Retail Link. Dispute chargebacks within the allowed window with supporting documentation. Even small improvements in OTIF can significantly reduce chargeback exposure.
What is the cost of a poor vendor scorecard in retail?
The direct cost includes chargebacks ranging from $0.50 to $100+ per violation depending on the retailer and violation type. Walmart charges $5.00 per late PO, Kroger charges 10% of order value for mis-shipments, and packaging violations can be $100 per order. But the indirect costs are larger: lost shelf space, reduced PO volume, damaged buyer relationships, and in extreme cases, account holds or deauthorization. For mid-size CPG suppliers, annual chargeback exposure can easily reach $50,000–$500,000+.
Can I dispute retailer scorecard chargebacks?
Yes, and you should. Every major retailer provides a chargeback dispute process with a defined window (typically 30–90 days). Common grounds for successful disputes include carrier delivery errors (proof the shipment left on time), receiving errors at the DC (ASN data proves correct shipment), system glitches generating duplicate chargebacks, and chargebacks applied to the wrong PO. Industry estimates suggest 15–30% of chargebacks can be successfully reversed with proper documentation.
Improve your vendor scorecard
RetailerHub helps you instantly understand any retailer’s compliance requirements, generate warehouse-ready SOPs, and get alerted when scoring criteria change. Built by a former ShipBob Lead WMS Engineer with 10+ years in fulfillment.
Related Guides
Retail Chargebacks Guide
Common chargeback types, retailer penalties, and prevention strategies.
SoftwareVendor Compliance Software
What to look for, how it reduces chargebacks, and how it differs from vendor management.
Getting StartedRetail Vendor Onboarding
Step-by-step guide to onboarding with major retailers and setting up compliance.
Streamline retail compliance with our AI-powered system.
- Quick Links
- Home
- Pricing
- Who We Are
- Contact Us
- adrian@retailerhub.ai
Copyright © 2026 RetailerHub. All Rights Reserved.